
这是一个创建于 2776 天前的主题,其中的信息可能已经有所发展或是发生改变。
设备配置及操作系统
cpu :英特尔至强 E5-2640V3 处理器 2.6GHz 8 核 2 颗 mem : 8G , DDR4-2133 RDIMM , 32 条,共 256G 硬盘 1 : 1.2T ,万转 sas 做数据盘, 24 块 硬盘 2 : 600G ,万转 sas 做系统盘, 2 块 RAID 卡: 2G 缓存 网卡: 2*10GE ( SFP+),原厂的 操作系统: suse11sp4 Linux hebda_data_33 3.0.101-77-default #1 SMP Tue Jun 14 20:33:58 UTC 2016 (a082ea6) x86_64 x86_64 x86_64 GNU/Linux 上联交换机:华为 12812 网卡信息:
ethtool -i p4p2
driver: bnx2x
version: 1.710.51-0
firmware-version: FFV08.07.25 bc 7.13.54
bus-info: 0000:83:00.1
supports-statistics: yes
supports-test: yes
supports-eeprom-access: yes
supports-register-dump: yes
hebda_data_33:~ # ethtool -i em1
driver: bnx2x
version: 1.710.51-0
firmware-version: FFV08.07.25 bc 7.13.54
bus-info: 0000:01:00.0
supports-statistics: yes
supports-test: yes
supports-eeprom-access: yes
supports-register-dump: yes

hebda_data_33:~ # lspci -s 0000:83:00.1 -vvv
83:00.1 Ethernet controller: Broadcom Corporation NetXtreme II BCM57810 10 Gigabit Ethernet (rev 10)
        Subsystem: Broadcom Corporation Device 1006
        Control: I/O- Mem+ BusMaster+ SpecCycle- MemWINV- VGASnoop- ParErr- Stepping- SERR- FastB2B- DisINTx+
        Status: Cap+ 66MHz- UDF- FastB2B- ParErr- DEVSEL=fast >TAbort- <TAbort- <MAbort- >SERR- <PERR- INTx-
        Latency: 0
        Interrupt: pin B routed to IRQ 60
        Region 0: Memory at c8000000 (64-bit, prefetchable) [size=8M]
        Region 2: Memory at c8800000 (64-bit, prefetchable) [size=8M]
        Region 4: Memory at ca000000 (64-bit, prefetchable) [size=64K]
        Expansion ROM at ca500000 [disabled] [size=512K]
        Capabilities: [48] Power Management version 3
                Flags: PMEClk- DSI- D1- D2- AuxCurrent=0mA PME(D0+,D1-,D2-,D3hot+,D3cold+)
                Status: D0 NoSoftRst+ PME-Enable- DSel=0 DScale=1 PME-
        Capabilities: [50] Vital Product Data
                Not readable
        Capabilities: [58] MSI: Enable- Count=1/8 Maskable- 64bit+
                Address: 0000000000000000  Data: 0000
        Capabilities: [a0] MSI-X: Enable+ Count=32 Masked-
                Vector table: BAR=4 offset=00000000
                PBA: BAR=4 offset=00001000
        Capabilities: [ac] Express (v2) Endpoint, MSI 00
                DevCap: MaxPayload 512 bytes, PhantFunc 0, Latency L0s <4us, L1 <64us
                        ExtTag+ AttnBtn- AttnInd- PwrInd- RBE+ FLReset-
                DevCtl: Report errors: Correctable- Non-Fatal+ Fatal+ Unsupported+
                        RlxdOrd+ ExtTag+ PhantFunc- AuxPwr+ NoSnoop+
                        MaxPayload 256 bytes, MaxReadReq 4096 bytes
                DevSta: CorrErr+ UncorrErr- FatalErr- UnsuppReq+ AuxPwr+ TransPend-
                LnkCap: Port #0, Speed 5GT/s, Width x8, ASPM L0s L1, Latency L0 <1us, L1 <2us
                        ClockPM+ Surprise- LLActRep- BwNot-
                LnkCtl: ASPM Disabled; RCB 64 bytes Disabled- Retrain- CommClk+
                        ExtSynch- ClockPM- AutWidDis- BWInt- AutBWInt-
                LnkSta: Speed 5GT/s, Width x8, TrErr- Train- SlotClk+ DLActive- BWMgmt- ABWMgmt-
                DevCap2: Completion Timeout: Range ABCD, TimeoutDis+
                DevCtl2: Completion Timeout: 65ms to 210ms, TimeoutDis-
                LnkCtl2: Target Link Speed: 2.5GT/s, EnterCompliance- SpeedDis-, Selectable De-emphasis: -6dB
                         Transmit Margin: Normal Operating Range, EnterModifiedCompliance- ComplianceSOS-
                         Compliance De-emphasis: -6dB
                LnkSta2: Current De-emphasis Level: -6dB, EqualizationComplete-, EqualizationPhase1-
                         EqualizationPhase2-, EqualizationPhase3-, LinkEqualizationRequest-
        Capabilities: [100 v1] Advanced Error Reporting
                UESta:  DLP- SDES- TLP- FCP- CmpltTO- CmpltAbrt- UnxCmplt- RxOF- MalfTLP- ECRC- UnsupReq- ACSViol-
                UEMsk:  DLP- SDES- TLP- FCP- CmpltTO- CmpltAbrt+ UnxCmplt+ RxOF- MalfTLP- ECRC- UnsupReq- ACSViol-
                UESvrt: DLP+ SDES+ TLP+ FCP+ CmpltTO+ CmpltAbrt- UnxCmplt- RxOF+ MalfTLP+ ECRC+ UnsupReq- ACSViol-
                CESta:  RxErr- BadTLP- BadDLLP- Rollover- Timeout- NonFatalErr+
                CEMsk:  RxErr- BadTLP+ BadDLLP+ Rollover+ Timeout+ NonFatalErr+
                AERCap: First Error Pointer: 00, GenCap+ CGenEn+ ChkCap+ ChkEn+
        Capabilities: [13c v1] Device Serial Number f4-e9-d4-ff-fe-9d-ba-10
        Capabilities: [150 v1] Power Budgeting <?>
        Capabilities: [160 v1] Virtual Channel
                Caps:   LPEVC=0 RefClk=100ns PATEntryBits=1
                Arb:    Fixed- WRR32- WRR64- WRR128-
                Ctrl:   ArbSelect=Fixed
                Status: InProgress-
                VC0:    Caps:   PATOffset=00 MaxTimeSlots=1 RejSnoopTrans-
                        Arb:    Fixed- WRR32- WRR64- WRR128- TWRR128- WRR256-
                        Ctrl:   Enable+ ID=0 ArbSelect=Fixed TC/VC=ff
                        Status: NegoPending- InProgress-
        Capabilities: [1b8 v1] Alternative Routing-ID Interpretation (ARI)
                ARICap: MFVC- ACS-, Next Function: 0
                ARICtl: MFVC- ACS-, Function Group: 0
        Capabilities: [220 v1] #15
        Kernel driver in use: bnx2x
        Kernel modules: bnx2x

hebda_data_33:~ # lspci -s 0000:01:00.0 -vvv
01:00.0 Ethernet controller: Broadcom Corporation NetXtreme II BCM57800 1/10 Gigabit Ethernet (rev 10)
        Subsystem: Dell BCM57800 10-Gigabit Ethernet
        Control: I/O- Mem+ BusMaster+ SpecCycle- MemWINV- VGASnoop- ParErr- Stepping- SERR- FastB2B- DisINTx+
        Status: Cap+ 66MHz- UDF- FastB2B- ParErr- DEVSEL=fast >TAbort- <TAbort- <MAbort- >SERR- <PERR- INTx-
        Latency: 0
        Interrupt: pin A routed to IRQ 40
        Region 0: Memory at 95000000 (64-bit, prefetchable) [size=8M]
        Region 2: Memory at 95800000 (64-bit, prefetchable) [size=8M]
        Region 4: Memory at 96030000 (64-bit, prefetchable) [size=64K]
        Expansion ROM at 96080000 [disabled] [size=512K]
        Capabilities: [48] Power Management version 3
                Flags: PMEClk- DSI- D1- D2- AuxCurrent=0mA PME(D0+,D1-,D2-,D3hot+,D3cold+)
                Status: D0 NoSoftRst+ PME-Enable- DSel=8 DScale=1 PME-
        Capabilities: [50] Vital Product Data
                Not readable
        Capabilities: [58] MSI: Enable- Count=1/8 Maskable- 64bit+
                Address: 0000000000000000  Data: 0000
        Capabilities: [a0] MSI-X: Enable+ Count=32 Masked-
                Vector table: BAR=4 offset=00000000
                PBA: BAR=4 offset=00001000
        Capabilities: [ac] Express (v2) Endpoint, MSI 00
                DevCap: MaxPayload 512 bytes, PhantFunc 0, Latency L0s <4us, L1 <64us
                        ExtTag+ AttnBtn- AttnInd- PwrInd- RBE+ FLReset-
                DevCtl: Report errors: Correctable- Non-Fatal+ Fatal+ Unsupported+
                        RlxdOrd+ ExtTag+ PhantFunc- AuxPwr+ NoSnoop+
                        MaxPayload 256 bytes, MaxReadReq 4096 bytes
                DevSta: CorrErr+ UncorrErr- FatalErr- UnsuppReq+ AuxPwr+ TransPend-
                LnkCap: Port #0, Speed 5GT/s, Width x8, ASPM L0s L1, Latency L0 <1us, L1 <2us
                        ClockPM+ Surprise- LLActRep- BwNot-
                LnkCtl: ASPM Disabled; RCB 64 bytes Disabled- Retrain- CommClk+
                        ExtSynch- ClockPM- AutWidDis- BWInt- AutBWInt-
                LnkSta: Speed 5GT/s, Width x8, TrErr- Train- SlotClk+ DLActive- BWMgmt- ABWMgmt-
                DevCap2: Completion Timeout: Range ABCD, TimeoutDis+
                DevCtl2: Completion Timeout: 65ms to 210ms, TimeoutDis-
                LnkCtl2: Target Link Speed: 2.5GT/s, EnterCompliance- SpeedDis-, Selectable De-emphasis: -6dB
                         Transmit Margin: Normal Operating Range, EnterModifiedCompliance- ComplianceSOS-
                         Compliance De-emphasis: -6dB
                LnkSta2: Current De-emphasis Level: -6dB, EqualizationComplete-, EqualizationPhase1-
                         EqualizationPhase2-, EqualizationPhase3-, LinkEqualizationRequest-
        Capabilities: [100 v1] Advanced Error Reporting
                UESta:  DLP- SDES- TLP- FCP- CmpltTO- CmpltAbrt- UnxCmplt- RxOF- MalfTLP- ECRC- UnsupReq- ACSViol-
                UEMsk:  DLP- SDES- TLP- FCP- CmpltTO- CmpltAbrt+ UnxCmplt+ RxOF- MalfTLP- ECRC- UnsupReq- ACSViol-
                UESvrt: DLP+ SDES+ TLP+ FCP+ CmpltTO+ CmpltAbrt- UnxCmplt- RxOF+ MalfTLP+ ECRC+ UnsupReq- ACSViol-
                CESta:  RxErr- BadTLP- BadDLLP- Rollover- Timeout- NonFatalErr+
                CEMsk:  RxErr- BadTLP+ BadDLLP+ Rollover+ Timeout+ NonFatalErr+
                AERCap: First Error Pointer: 00, GenCap+ CGenEn+ ChkCap+ ChkEn+
        Capabilities: [13c v1] Device Serial Number 18-66-da-ff-fe-65-77-0b
        Capabilities: [150 v1] Power Budgeting <?>
        Capabilities: [160 v1] Virtual Channel
                Caps:   LPEVC=0 RefClk=100ns PATEntryBits=1
                Arb:    Fixed- WRR32- WRR64- WRR128-
                Ctrl:   ArbSelect=Fixed
                Status: InProgress-
                VC0:    Caps:   PATOffset=00 MaxTimeSlots=1 RejSnoopTrans-
                        Arb:    Fixed- WRR32- WRR64- WRR128- TWRR128- WRR256-
                        Ctrl:   Enable+ ID=0 ArbSelect=Fixed TC/VC=ff
                        Status: NegoPending- InProgress-
        Capabilities: [1b8 v1] Alternative Routing-ID Interpretation (ARI)
                ARICap: MFVC- ACS-, Next Function: 1
                ARICtl: MFVC- ACS-, Function Group: 0
        Capabilities: [220 v1] #15
        Capabilities: [300 v1] #19
        Kernel driver in use: bnx2x
        Kernel modules: bnx2x

hebda_data_33:~ # ethtool -S p4p2|grep dis
     [0]: rx_discards: 79516
     [0]: rx_phy_ip_err_discards: 0
     [0]: rx_skb_alloc_discard: 28517
     [1]: rx_discards: 88484
     [1]: rx_phy_ip_err_discards: 0
     [1]: rx_skb_alloc_discard: 27102
     [2]: rx_discards: 13667973
     [2]: rx_phy_ip_err_discards: 0
     [2]: rx_skb_alloc_discard: 35207
     [3]: rx_discards: 33056205
     [3]: rx_phy_ip_err_discards: 0
     [3]: rx_skb_alloc_discard: 33533
     [4]: rx_discards: 13263091
     [4]: rx_phy_ip_err_discards: 0
     [4]: rx_skb_alloc_discard: 34748
     [5]: rx_discards: 7583294
     [5]: rx_phy_ip_err_discards: 0
     [5]: rx_skb_alloc_discard: 32756
     [6]: rx_discards: 3703892
     [6]: rx_phy_ip_err_discards: 0
     [6]: rx_skb_alloc_discard: 28380
     [7]: rx_discards: 31746726
     [7]: rx_phy_ip_err_discards: 0
     [7]: rx_skb_alloc_discard: 32609
     rx_discards: 103189181
     rx_mf_tag_discard: 0
     rx_brb_discard: 90068
     rx_phy_ip_err_discards: 0
     rx_skb_alloc_discard: 252852
 没有其它错误
hebda_data_23:~ # for i in `seq 1 10`; do ifconfig p4p2 | grep RX | grep overruns; sleep 1; done
          RX packets:253639505018 errors:305619311 dropped:0 overruns:305375168 frame:244143
          RX packets:253639552428 errors:305619311 dropped:0 overruns:305375168 frame:244143
          RX packets:253639566818 errors:305619311 dropped:0 overruns:305375168 frame:244143
          RX packets:253639585722 errors:305619311 dropped:0 overruns:305375168 frame:244143
          RX packets:253639597202 errors:305619311 dropped:0 overruns:305375168 frame:244143
          RX packets:253639610209 errors:305619311 dropped:0 overruns:305375168 frame:244143
          RX packets:253639622800 errors:305619311 dropped:0 overruns:305375168 frame:244143
          RX packets:253639642350 errors:305620450 dropped:0 overruns:305376307 frame:244143
          RX packets:253639675509 errors:305620450 dropped:0 overruns:305376307 frame:244143
          RX packets:253639723772 errors:305620471 dropped:0 overruns:305376328 frame:244143
hebda_data_23:~ # for i in `seq 1 10`; do ifconfig p4p2 | grep RX | grep overruns; sleep 1; done
          RX packets:253639788669 errors:305620773 dropped:0 overruns:305376630 frame:244143
          RX packets:253639812355 errors:305621201 dropped:0 overruns:305377058 frame:244143
          RX packets:253639834600 errors:305621201 dropped:0 overruns:305377058 frame:244143
          RX packets:253639892990 errors:305621455 dropped:0 overruns:305377312 frame:244143
          RX packets:253639913026 errors:305621455 dropped:0 overruns:305377312 frame:244143
          RX packets:253639919136 errors:305621455 dropped:0 overruns:305377312 frame:244143
          RX packets:253639935095 errors:305622380 dropped:0 overruns:305378237 frame:244143
          RX packets:253639954560 errors:305623012 dropped:0 overruns:305378869 frame:244143
          RX packets:253639961150 errors:305623012 dropped:0 overruns:305378869 frame:244143
          RX packets:253639971680 errors:305623012 dropped:0 overruns:305378869 frame:244143
业务配置
Gp DB 4.3
问题描述
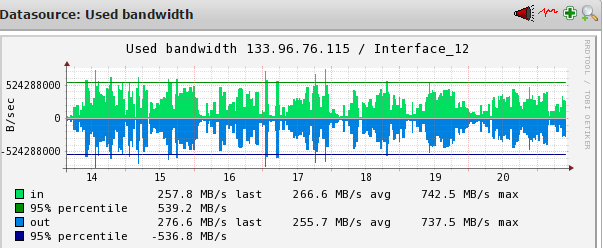
安装应用后网卡的使用情况如下图: 但是在高峰时通过 nagios 会发现整个集群每个节点都报下面的错误,裸跑的时候也有类似的报错,但是没有来得及抓网卡的包:
Interface 11
Active checks of the service have been disabled - only passive checks are being accepted	Perform Extra Service Actions
CRITICAL	09-20-2016 10:47:51	0d 0h 11m 46s	1/1	CRIT - [p4p2] (up) MAC: f4:e9:d4:9d:cb:92, 10.00 Gbit/s, in: 262.67 MB/s, in-errors: 0.16%(!!) >= 0.1, out: 237.76 MB/s
实际使用的命令是:
echo '<<<lnx_if:sep(58)>>>'
sed 1,2d /proc/net/dev
整体上来看, errors 在 0.1%-0.6%之间,极少的能达到 1%,当时的流量也从 20M-200MB 左右不等。
- 第一个问题是:这是不是问题?我个人感觉应该是,所以个人花了精力来处理,各位大神意见?
- 第一个问题是:如何解决?我有一点思路,请大神拍一下。 看了网上大家写的,怀疑问题是在 rx errors ,而且我看 overrun 比较多,是否不是 ring_buffer 的问题,而是中断的问题?
 |
1
shidifen OP @redsonic ,我有一个类似的问题,请教一下,大神帮忙。题目是“ dell r730 安装 Gp 后万兆网卡有 rx error ”
|
 |
2
redsonic 2016-09-21 02:16:24 +08:00
能贴一下 cpu 负载吗, QPS 是多少?
我觉得应该是 cpu 过载了吧 “当时的流量也从 20M-200MB 左右不等” 意思是每秒流量压力不是平稳的? 能不能配合流量图看一下 error 和 overrun 的关系。 |
|
3
shidifen OP 先感谢大神,太及时了,我同时在几个网站提的,这个最快
 ) ) |
|
4
shidifen OP 我解释一下“当时的流量也从 20M-200MB 左右不等”,流量确实是不平稳的,而且可以确认流量大时有,流量小的时候没有。
网络图在这  ) ) |
|
5
shidifen OP 流量大时有 error ,流量小的时候没有。
|
|
6
redsonic 2016-09-21 13:39:17 +08:00
你有 32 个逻辑 cpu ,而且负载不高,是不是中断都绑到一个 cpu 上去了,看一下 /proc/interrupts 。 如果你开了 irqbalance 服务把它关了,然后手动绑中断到各个 cpu 。 没搞过的话可以参照 http://www.stateam.net/2016/02/292
|
|
7
shidifen OP 大神,我查过了,截图如下 cpu si 不集中,而且 irqbalance ,看来您也认为这是个问题。
[cpu](  ) ) |
|
8
shidifen OP ```
cat /proc/interrupts |grep p4p2|awk '{print $1,$2,$3,$4,$5,$6,$7,$8,$9,$NF-2,$NF-1,$NF}' 189: 23 1910 0 23712 0 5819 0 17237 -2 -1 p4p2 191: 3 1298600 0 4960284 0 2318276 0 39993639 -2 -1 p4p2-fp-0 192: 3 10001905 0 59523308 0 91985518 0 127790073 -2 -1 p4p2-fp-1 193: 3 11441976 0 258662301 0 388562940 0 575324868 -2 -1 p4p2-fp-2 194: 3 40000208 0 318757279 0 518502447 0 617694135 -2 -1 p4p2-fp-3 195: 3 19019621 0 454066151 0 695202386 0 554029662 -2 -1 p4p2-fp-4 196: 11 326794259 0 2075443900 0 1914823036 0 1712511864 -2 -1 p4p2-fp-5 197: 3 50776115 0 1363045548 0 533311176 0 1048504898 -2 -1 p4p2-fp-6 198: 3 36012441 0 1125578323 0 803794796 0 874562863 -2 -1 p4p2-fp-7 ``` |
|
9
shidifen OP 不会和 bois 的设置有关系吧?移动的硬件入场那个垃圾,根本没有人懂。
|
|
10
redsonic 2016-09-21 18:20:22 +08:00
cpu 压力不大。不管怎样先把 irqbalance 关掉,手动绑了再看看。和硬件问题有关的一般是寨卡和国产的 SFP+模块。
另外你那 wa 为什么这么高? 跑数据库了? |
|
11
shidifen OP 1. 大神,确实这个集群的机器是在跑 greenplum 的数据库,所以 wa 会有一些。
2. irqbalance 确实开着,全关了,然后被拉去开会,回来一看立时就看到 cpu si 集中到一个核上了,所以只好先打开,我看看文档争取一下把绑定全做了,幸亏开始的时候在上面部署了 salt ,不然一个人一个个做过去,死了。 3. 如何确认寨卡,我看 intel 的还有个程序可以检测,我们用的是 Broadcom BCM57810 10 Gigabit Ethernet ,供货商是个 js ,这个有办法识别是否寨卡,我看 taotao 上卖这个挺多,不敢说会不会是,光模块看了,是马来产 |
|
12
shidifen OP ```
cat /proc/interrupts |grep p4p2 我用 ue 看了看,还是很有规律的。 189: 23 1910 0 23712 0 5819 0 17237 0 5376 0 56987 0 99061 0 8446 0 210719 0 17656 0 9158 0 10846 0 15137 0 304803 0 390534 0 774799 IR-PCI-MSI-edge p4p2 191: 3 1790680 0 10616665 0 62155547 0 51990594 0 28726188 0 4981410 0 14502611 0 73392654 0 1514807584 0 50490160 0 36799635 0 31323666 0 34551994 0 1841649566 0 4080397994 0 645370109 IR-PCI-MSI-edge p4p2-fp-0 192: 3 10001905 0 59523308 0 91985518 0 127790073 0 226232145 0 68948743 0 53568007 0 139196477 0 2199357135 0 17363297 0 106875992 0 192090680 0 207748476 0 4157890819 0 75973239 0 522926553 IR-PCI-MSI-edge p4p2-fp-1 193: 3 17101328 0 276032420 0 406790277 0 582324878 0 341336810 0 587700803 0 273444019 0 626032634 0 1015882162 0 639888141 0 1073516044 0 592148466 0 423007262 0 89076476 0 778398606 0 869867536 IR-PCI-MSI-edge p4p2-fp-2 194: 3 40280877 0 382936413 0 525153622 0 639028845 0 463062554 0 375178493 0 522825186 0 776598788 0 146472313 0 575108019 0 646425393 0 777351438 0 755557817 0 53563221 0 480382819 0 968528415 IR-PCI-MSI-edge p4p2-fp-3 195: 3 19157407 0 462878595 0 700714489 0 578481977 0 587614373 0 603026304 0 449605352 0 601554280 0 726230782 0 605540303 0 768006014 0 539097451 0 1099203513 0 80342630 0 170116494 0 482882557 IR-PCI-MSI-edge p4p2-fp-4 196: 11 326794259 0 2075443900 0 1914823036 0 1712511864 0 1491815039 0 768009701 0 626173817 0 1033024867 0 1303540739 0 1654168784 0 1458276685 0 1366877077 0 997404728 0 3603056177 0 15650855 0 1529467882 IR-PCI-MSI-edge p4p2-fp-5 197: 3 51207795 0 1381837753 0 542946245 0 1060608865 0 701987854 0 399374560 0 335176577 0 408752021 0 125841732 0 679175184 0 724132714 0 587519037 0 446235402 0 172909262 0 164639268 0 580566984 IR-PCI-MSI-edge p4p2-fp-6 198: 3 36012441 0 1134119927 0 812983145 0 883702589 0 1064498302 0 208541493 0 415344892 0 631032811 0 75737917 0 317337699 0 688038432 0 503944441 0 698137741 0 27688040 0 313802737 0 413330289 IR-PCI-MSI-edge p4p2-fp-7 ``` |
|
13
shidifen OP @redsonic ,大神,我有 32 核 CPU ,但是按您给的手册中说的,只有 8 个中断队列,那只能手工绑定到 8 个 cpu ,不是不如 irqbalance ,那个至少还可以占用 16 个核?
另外, ring_buffer 是否需要调大? Ring parameters for p4p2: Pre-set maximums: RX: 4078 RX Mini: 0 RX Jumbo: 0 TX: 4078 Current hardware settings: RX: 453 RX Mini: 0 RX Jumbo: 0 TX: 4078 |
|
14
redsonic 2016-09-22 14:35:42 +08:00
我看你的 cpu 负载不高,所以为了排除其他因素只能停掉 irqbalance 再观察。 irqbalance 的原理是不停修改中断描述来实现平衡,并不是一种很 native 的方法,先手工绑了再看。
调整 ring_buffer 能减少突发流量的丢包,不能解决持续丢包。它其实就是一个 FIFO , O 的速度赶不上 I 的速度肯定还是会丢。 |
|
15
shidifen OP @redsonic 我按您提供的手册找了两个节点,这样做的:
``` service irq_balancer stop echo "1"> /proc/irq/191/smp_affinity echo "2"> /proc/irq/192/smp_affinity echo "4"> /proc/irq/193/smp_affinity echo "8"> /proc/irq/194/smp_affinity echo "16"> /proc/irq/195/smp_affinity echo "20"> /proc/irq/196/smp_affinity echo "40"> /proc/irq/197/smp_affinity echo "80"> /proc/irq/198/smp_affinity ``` |
|
16
shidifen OP 做完了后, cpu si 有下降,但是 rx error 和 overrun 还在增长,我在观察。
|
|
19
shidifen OP 而且做了修改的那两个节点,确实是只前 8 个核的 cpu si 有值,其它的核这个值就没有,是否能够增加队列,这样可以有更多的核参与中断?
|
|
21
shidifen OP @redsonic 现在整个库有点慢,我不知道是否和我修改那个参数有关系,想问一下,如果想回退手工绑定的方式,直接把 irqbalance 开起来就可以了吧,因为没有看到别的地方有说这个,如果真是改了参数,但是传输速率下来了,那还得改回去。
另外,有一些文档提到这个,有什么建议么? echo fffffe > /sys/class/net/em1/queues/rx-0/rps_cpus echo fffffe > /sys/class/net/em1/queues/rx-1/rps_cpus echo fffffe > /sys/class/net/em1/queues/rx-2/rps_cpus echo fffffe > /sys/class/net/em1/queues/rx-3/rps_cpus echo 4096 > /sys/class/net/em1/queues/rx-0/rps_flow_cnt echo 4096 > /sys/class/net/em1/queues/rx-1/rps_flow_cnt echo 4096 > /sys/class/net/em1/queues/rx-2/rps_flow_cnt echo 4096 > /sys/class/net/em1/queues/rx-3/rps_flow_cnt echo 4096 > /sys/class/net/em1/queues/rx-4/rps_flow_cnt echo 20480 > /proc/sys/net/core/rps_sock_flow_entries 对于 2 个物理 cpu,8 核的机器为 ff ,具体计算方法是第一颗 cpu 是 00000001 ,第二个 cpu 是 00000010 ,第 3 个 cpu 是 00000100 ,依次类推,由于是所有的 cpu 都负担,所以所有的 cpu 数值相加,得到的数值为 11111111 ,十六进制就刚好是 ff 。而对于 /proc/sys/net/core/rps_sock_flow_entries 的数值是根据你的 tob_id_2536 网卡多少个通道,计算得出的数据,例如你是 8 通道的网卡,那么 1 个网卡,每个通道设置 4096 的数值, 8*4096 就是 /proc/sys/net/core/rps_sock_flow_entries 的数值 中断合并 ethtool -c em1 |
|
22
redsonic 2016-09-23 14:32:08 +08:00 队列数由硬件决定,更高端的我也只用过 intel 的 82599 , x540 。寨卡用人眼去看确实很难判别,除了用 ethtool 看 rom 里的信息恐怕只有询报价了,原厂 OEM 的比寨卡贵一倍以上。
像 RPS , irqbalance 这样的软件方案对于服务器采集级别的应用没什么正面作用。网上那些都是针对单路工作站跑千兆或单队列网卡而言的。 若要恢复就把 irqbalance 开启。 可以试试把其他重任务绑定到靠后面的 cpu ,网卡用的那 8 个别被其他任务调度。 |
|
23
shidifen OP 寨卡的问题,可能是解决了。我们从 dell 要了主机和网卡 ppid 的对应关系,可以与现网的设备进行核对。
|
|
24
shidifen OP 忘记说了,其实我们使用 iperf 测试过网卡的,带宽完全没有问题,只是测试的时候也有错包。
|
|
25
shidifen OP 准备换一种方法再测试一次。
|